Making an automated trading research system visible, decision by decision
Automated trading research is hard to inspect. A system can run for weeks, and when its results change, it's hard to say what it looked at, what it decided, and how this month compares with last month. Mentor Sentinel is the paper-trading research platform I built to answer those questions. It runs crypto and equities research on live market data.
At a glance
Project: My own research software
- Type: Paper-trading research platform
- My role: Concept, system design and development of the data, scheduling, service and dashboard layers
- Markets: Crypto and equities, researched with live market data and simulated funds
- Built with: Python, FastAPI and Uvicorn; pandas and TA-Lib; PostgreSQL and Redis; WebSockets; CCXT; APScheduler; MCP integrations
- Website: mentorsentinel.ai
Research workflows on live data with simulated funds
Mentor Sentinel grew out of my earlier crypto research system and now covers equities as well. Strategies run against live market data, and their decisions are executed against simulated funds. That makes it possible to study how a system behaves in real market conditions without putting money at risk.
Dashboards, replay and monitoring
Running a system is easy. Understanding it is the hard part. The platform has three ways to look at what's happening:
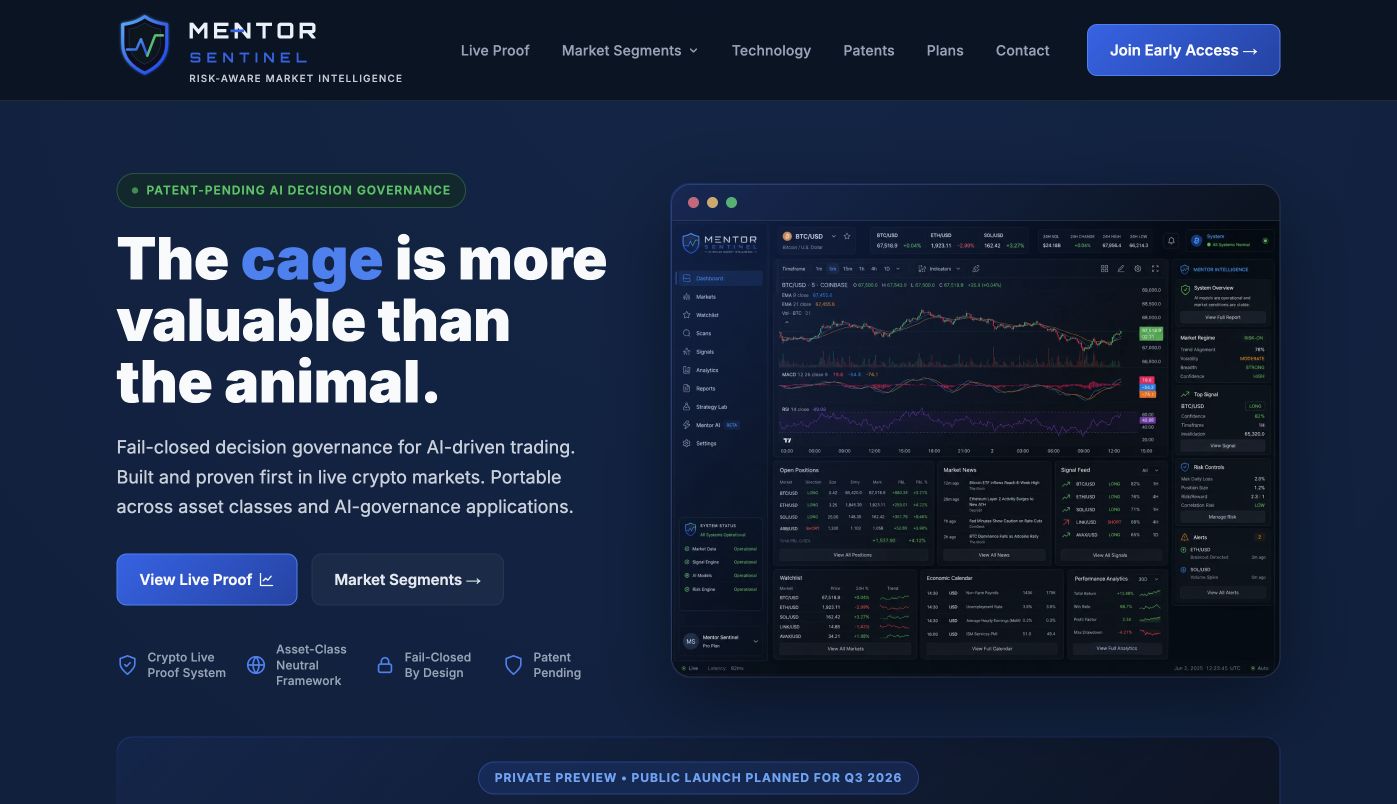
- Dashboards show the current state: what's being tracked, what the system is doing and how its simulated positions stand.
- Historical replay steps back through what happened, so you can see what the system considered at a given moment and how it responded.
- Monitoring watches behavior over time, so changes stand out instead of getting buried in logs.
Together they make results something you can examine instead of take on faith.
The systems underneath
This is a working software system, with a public website on top. Behind the dashboards:
- Data processing turns raw market data into the indicators and features strategies use.
- Scheduling runs collection, analysis and housekeeping jobs on a reliable timetable.
- Service interfaces expose the system's state and history to the dashboards and other tools.
- MCP integrations let an AI assistant query the system directly, so a question about behavior can be answered from the system's own records.
Where Recordant came from
As the platform grew, the diagnostic side, which turns logs and changes into findings someone can act on, became useful in its own right. I extracted it into Recordant, a separate, self-hosted product for software operators.
Technology and what it does here
Python: The core language for research, data processing and services
- FastAPI and Uvicorn: Service interfaces that serve system data to dashboards and tools
- pandas and TA-Lib: Market data processing and technical indicators
- PostgreSQL: Durable storage for market data, decisions and history used in replay
- Redis: Fast shared state for live parts of the system
- WebSockets: Live updates to dashboards
- CCXT: Connections to crypto market data sources
- APScheduler: Scheduled collection and analysis jobs
- MCP: Lets AI assistants query the system's records directly
Need to see what your automated systems are doing?
The same approach works for any automated process where decisions need to be examined later, such as pricing, scheduling, inventory or quality checks. I can build dashboards, replay and monitoring around the systems your business depends on.